Power BI Data Analytics Case Study — Databel
Welcome to the Databel Case Study. In this case study, I’ll be sharing how I used Data Analytics to help Databel understand customer retention and churn trends to grow as a global company by shaping their marketing strategy.
Throughout this case study, I will use Power BI as my data analytics tool. I will also follow a structured data analysis process: Ask, Prepare, Process, Analyze, Share & Act. By adopting this methodology, I aim to uncover key insights into Databel’s data-driven strategies.


ASK PHASE
Scenario
The director of marketing at Databel, a fictional Telecom provider company believes the company’s future success depends on retaining their customers, since there have been an increasing number of customer churns. Therefore, I’ve been hired as a consultant analyst to help understand the customer churn rate and why customer are stopping doing business with Databel. From these insights, the marketing team will design a new marketing strategy to retain customer. But first, Databel executives must approve my recommendations, so they must be backed up with compelling data insights and professional data visualizations.
Problem: Customers are leaving Databel.
Solution: Understand customer churn to retain clients.
Business Task/Purpose:
The goal of this project is to study Databel’s customer data in order to understand why clients are leaving.
From these insights, the marketing team will identify recommendations for designing strategies to retain Databel customer, which will be presented to the executive team for approval.
Stakeholders: Executive team members, the director of marketing, and the Databel’s marketing analytics team.
PREPARE PHASE
Data Sources:
The data source used for this analysis is a CSV dataset obtained from Datacamp’s course ‘Case Study: Analyzing Customer Churn in Power BI’, which is a snapshot of Databel’s dataset at a specific moment in time and has 29 columns and each row represents one customer.
To evaluate the data’s credibility and integrity in detail, we can assess the most important data aspects:
- Reliable The data is reliable because it’s the database provided by Databel.
- Original: The data is original because it’s real customer data about Databel’s internal client database.
- Comprehensive: The data is comprehensive because it includes all attributes of the customers.
- Current: The data is current if we take into account that I’m analyzing it from a recent snapshot of the database.
- Cited: The data is cited because it’s from Databel’s internal database.
It’s important to address the data-privacy issues present in the license under which the data has been available to the public, which is based on Databel’s data privacy. Since it’s fictional data from a fictional company, we can use it to analyze insights and trends.
These spreadsheets are organized in a wide format, where each row represents one specific customer and the columns contain different attributes of the customer, which include ID, charges, calls, type of plan, churn label, demographic field, and so on.
Exploring the Database
We’re going to open the CSV file in Power BI in order to check and explore our Databel’s dataset, to look for errors, duplicates and missing data.
- First, we check for missing data, errors and duplicated in the Power Query Editor:
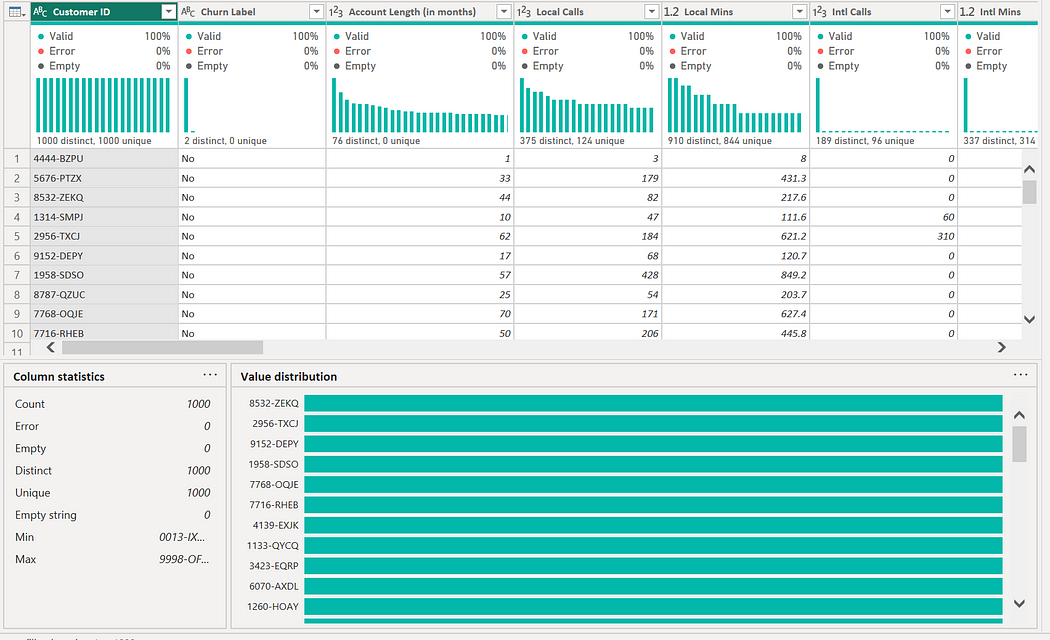
— We can see there are no errors or emply values, and all the values the customer ID column are distinct and unique.
- Alternatively, if we want to make sure all the customers have a unique ID without opening the Power Query Editor, we can create two measures, one for the number of customers, and another for the total distinct number of customers, so we can compare both numbers.
Number of Customers = COUNT('Databel - Data'[Customer ID])
Number of Unique Customers = DISTINCTCOUNT('Databel - Data'[Customer ID])
To see the values of these measures, we can create two cards.
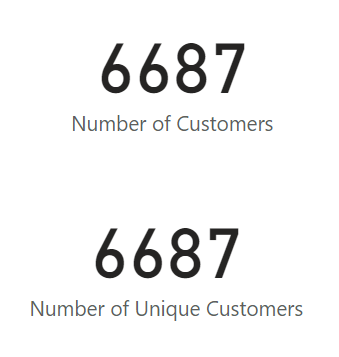
— Since both numbers match, all ID’s are correctly entered to the database, with no duplicated ID’s.
We also check that all the column have appropiate names, so we proceed to the process phase.
PROCESS PHASE
Adding New Columns and Measures
- Now we want to calculate the ‘Churn Rate’. We can see that we have a column ‘Churn label’ that displays values of ‘yes’ and ‘no’. However, to know the number of churned customers, we can first turn this column into one that displays values of ‘1’ and ‘0’ — ‘1’ meaning the customer churned. This way we can sum this column to get the number of churned customers, so then we can calculate the churn rate.
Churned = if('Databel - Data'[Churn Label] = "Yes", 1, 0)
Number of Churned Customers = sum('Databel - Data'[Churned])
Churn Rate = DIVIDE([Number of Churned Customers], [Number of Unique Customers])
We can see the Churn Rate in another card visualization:

Changing the Format and Data Categories of Columns
We’ll change the data category of the column “State” to ‘State or Province’, so the maps for the states work as intended.
Note: In this case study, we’ll be creating other columns and measures as we’re analyzing the data and we consider creating them for better visualization and understanding; so, in this report, many steps of the process phase will be put inside the analyze phase.
Data Cleaning Documentation
Change Log
Version 3.0.0 (09–25–2023)
New
- The Power BI program was selected for its high functionality at cleaning, visualizing and analyzing data.
- Created measures ‘Number of Customers’ and ‘Unique Number of Customers’ to check for duplicates.
- Created column ‘Churned’ to display values of ‘1’ and ‘0’. Created measure ‘Number of Churned Customers’ and ‘Churn Rate’.
- Created column ‘Demographics’, which displays the values ‘Senior’, ‘Under 30’ and ‘Other’. Created Age (bins), which creates bins of size 5 of the column age.
- Created a new column “Contract Category”, which includes only ‘monthly’ and ‘yearly’ values.
- Created a new column “Grouped Consumption” for classifying GB download into 3 categories: less than 5 GB, between 5 and 10 GB, and 10 or more GB.
- Created a new column “Intl Min Category” to group Intl Min by Very Low < 30, Low <60, Moderate < 200, High <500 and Very High ≥ 500.
Changes
- Changed the format of “Monthly charge” to currency.
- Changed the Data Category of “State” to ‘State or province’.
After these steps it’s confirmed that the data is integral, clean and ready to analyze.
ANALYZE AND SHARE PHASES
Analyzing and Visualizing Data
Churning Reasons and Demographics
First we’re going to find out the main reasons why customers churn.

- The main reasons why customers churn is because competitors have better offers and devices.
- Another important reason is the bad attitude of support people.
We also want to know the more general churn category to which these reasons belong to:
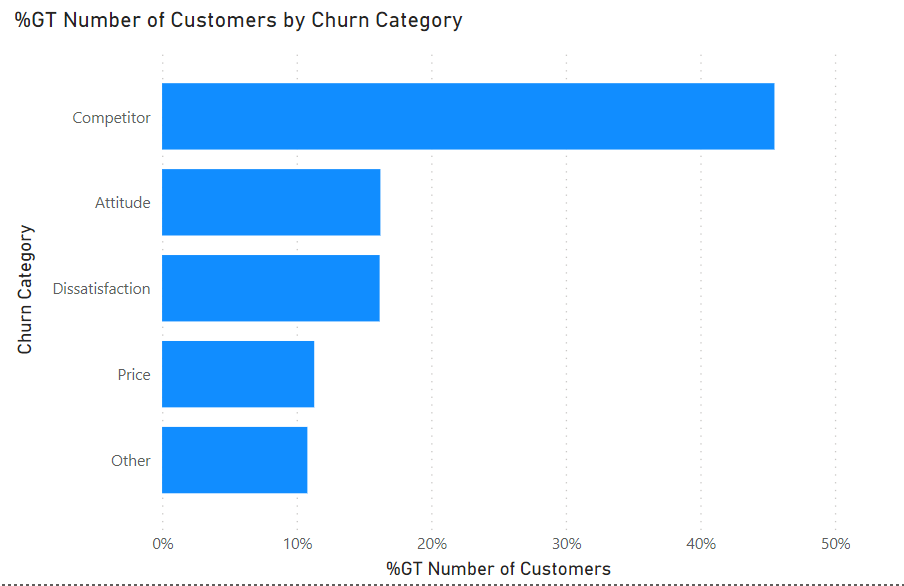
- As we saw earlier, the most common category reasons for churning are because of competitors (45.51%), following attitude, dissatisfaction and price.
I communicated this insight to my manager and he told me that Databel’s marketing analytics team, and they informed me that some competitors seem to be running aggressive promos in certain states, so I decided to investigate this further:
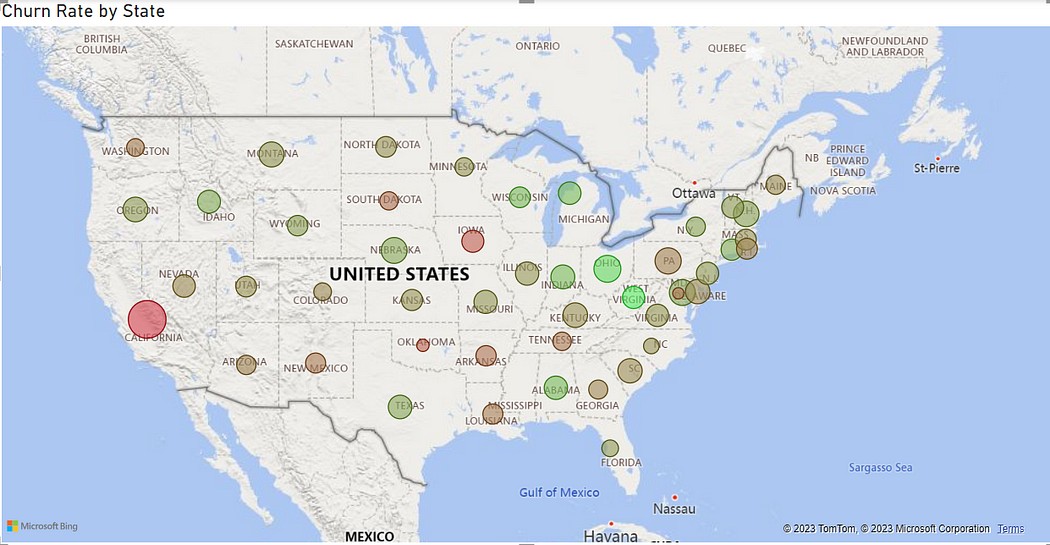
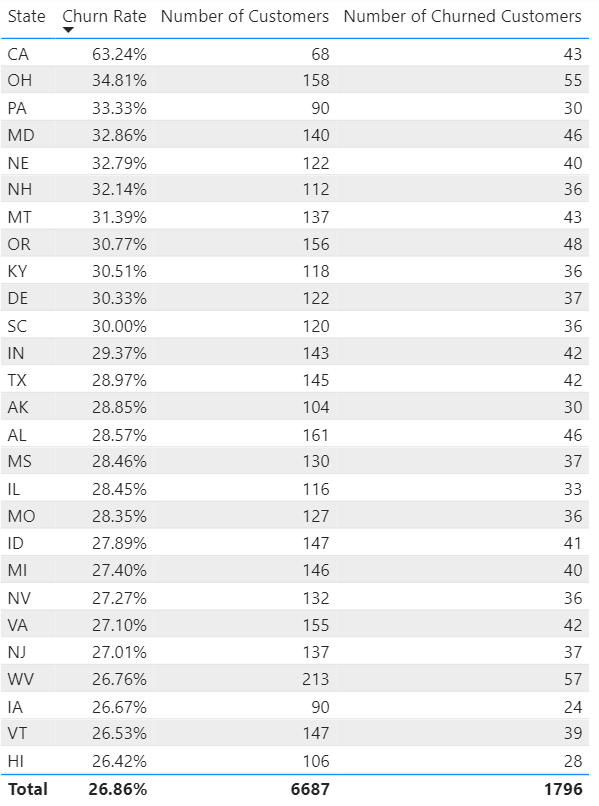
- We can see that the state with a whopping churn rate is California.
Age Analysis
In our database we have the columns “Senior” and “Under 30”, which only admits boolean values of “Yes” and “No”. First, we’ll create a table for these columns so we can know which category of customer churn more:
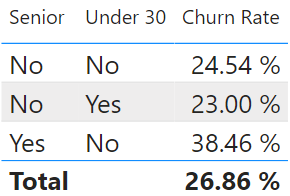
- Senior customers are the ones that are more likely to churn (38.46%).
We’ve seen the age categories, but now want more granularity with the ages, so we’ll create bins for the column “Age”, so we can create a histogram with ages of size 5 to visualize the number of customers and the churn rate:
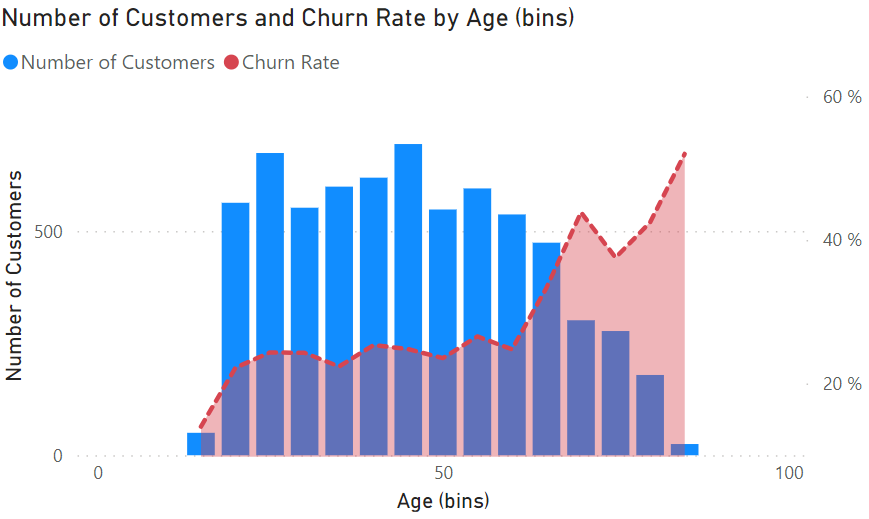
- Most customers are between 20–65 years old.
- From the age 70 to 85, the churn rate increases significantly. This is in harmony with what we discovered earlier about senior customers.
Groups and Categories Analysis
Now, to make the most of the Senior and Under 30 columns, we’ll create a new column “Demographics”, which will show whether the customer is Senior, under 30 or other within the same column:
Demographics = if('Databel - Data'[Senior]="Yes","Senior",If('Databel - Data'[Under 30]="Yes","Under 30","Other"))The column “Group” tell us whether customers are using the product induvidually or as part of a group of people who live in the same appartment; the exact number of the group the customer shares is found in the “Number of customer per group” column. We’ll create a line and stacked column chart to visualize the monthly average charge by the number of customers per group and churn rate as the line:
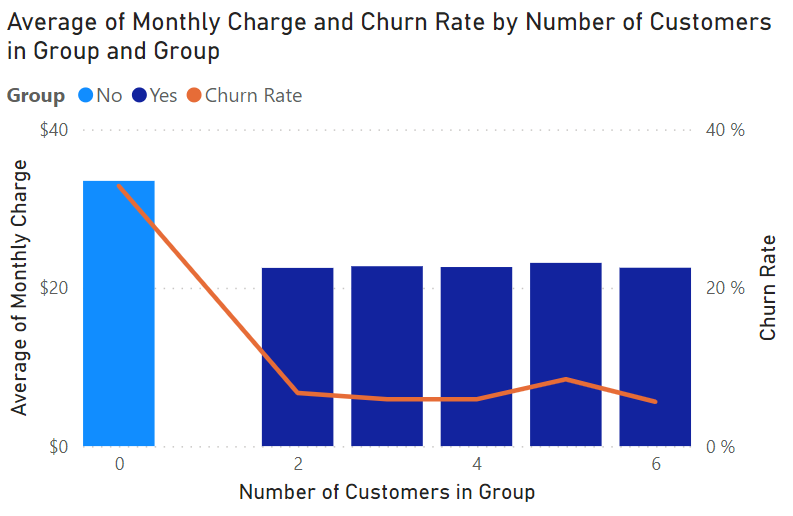
- We can see that customers that charge per group spend significantly less and are also less likely to churn; this is due to the company’s plans that offer discounted prices.
The contract type includes monthly and contracts of 1 and 2 years. Let’s visualize which types of contracts are more common among Databel’s customers:
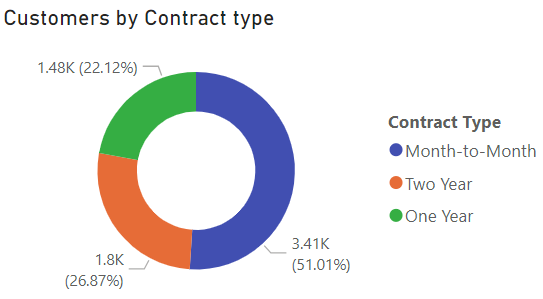
- Most customers pay the services monthly, followed by customers who acquire and pay the service for a two-year period. This might explain why there are so many churns, since monthly contracts don’t offer the best cost-benefit prices.
For our next visualization we want to change the contract type column and create a new column “Contract Category” that only contains monthy and yearly contracts:
Contract Category = SWITCH('Databel - Data'[Contract Type], "One Year", "Yearly", "Two Year", "Yearly", "Monthly")This way we can explore the churn rates by contract category and gender:
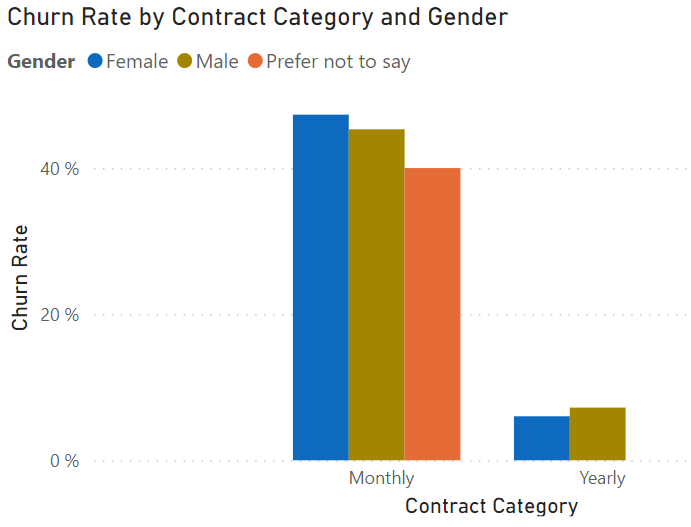
- It’s clear that customers with a yearly contract of the service are less likely to churn by a great margin, this is likely because yearly contracts are cheaper in the long run than monthly contracts.
- On the other hand, there isn’t a significant difference between genders and their churn rate.
Local Minutes Analysis
Let’s analyze the number of minutes customers spent in calls, and their relationship with whether they churned or not:

- Customers that churn generally make less local calls, and spend less minutes on average on calls. This is expected, as clients that don’t make much use of Databel’s services might feel it’s not worth paying for them.
Let’s see if there’s any relationship between local calls and amount charged, since customers have different kinds of plans:
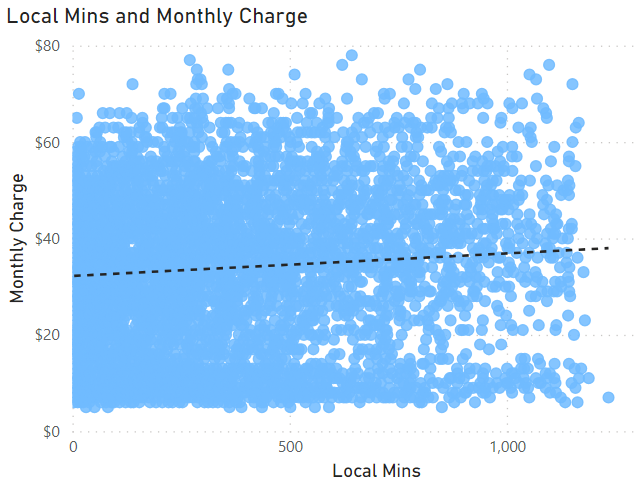
- The relationship between the local minutes spent on calls and monthly charge is slight, showing subtle positive correlation. This is expected, as more calls means more charge; however, this is not the only service that is charged and customers have different types of plans and contracts with Databel, that’s why this relationship is very slight.
Unlimited Plan Analysis
Now, let’s try to find insights about the extra charges customers include with the unlimited plan, we can start with a summarized table:

- The customers who have unlimited data plan are more likely to churn.
This is a very interesting finding, to find out why, let’s relate this to the amount of data being used in GB. For this we have the “average monthly GB download” column, for which we could create a new column that classifies the GB download in three categories (less than 5 GB, between 5 and 10 GB, and 10 or more GB):
Grouped Consumption = IF('Databel - Data'[Avg Monthly GB Download]<5,"Less than 5 GB", IF('Databel - Data'[Avg Monthly GB Download]<10,"Between 5 and 10 GB","10 or more GB"))First, we can visualize churn rates by the “Grouped Consumption” column we just created:
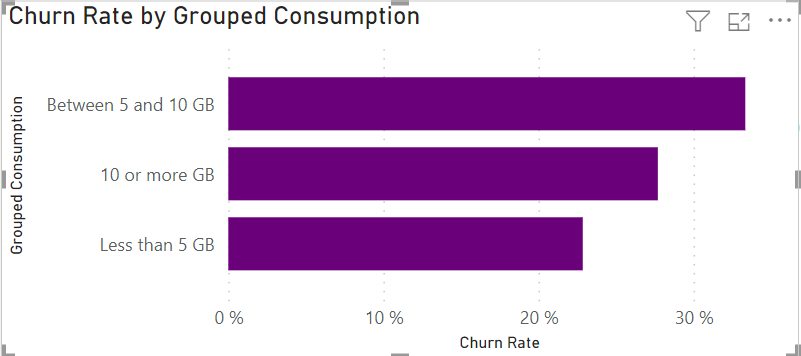
- Customers who download or consume between 5 and 10 GB of data are more likely to churn than those who spend less than 5 GB and at least 10 GB.
Now we can also create a clustered bar chart for churn rate by grouped consumption and unlimited data plan:
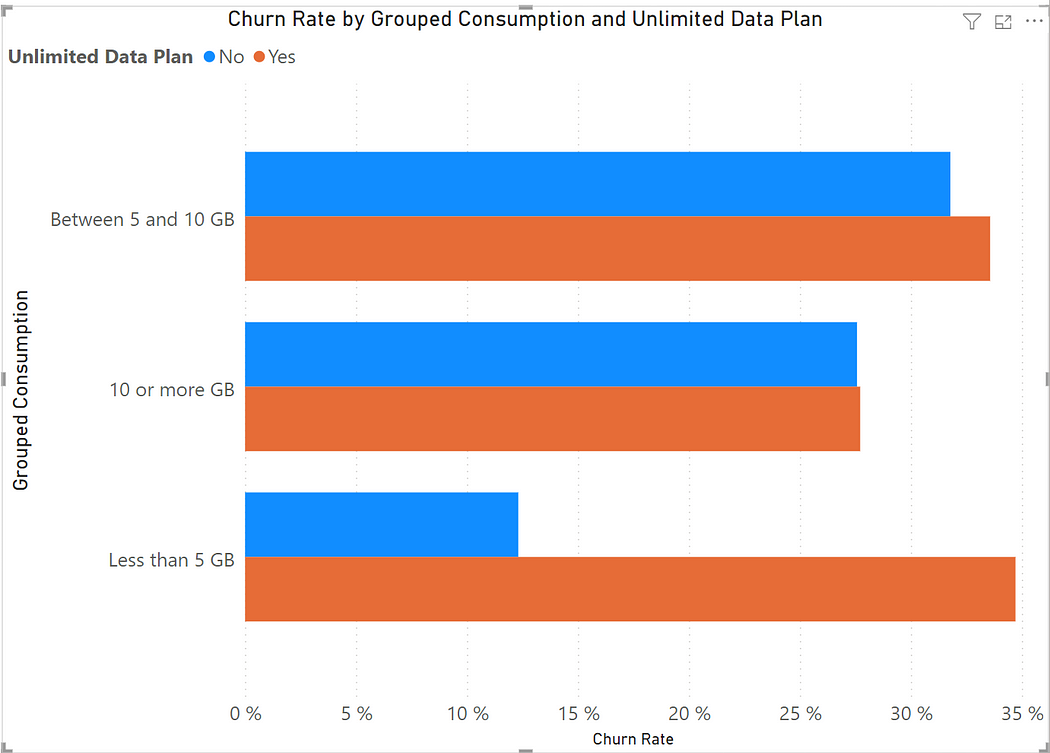
- There’s an intereting trend for customers who consume less than 5 GB of data: If they have an unlimited plan they’re the most likely to churn among all of these groups, but if they don’t, it’s the group who is the least likely to churn, with a churn rate of only 12,31%.
- When customers consume at least 5 GB of data, there’s so significant difference for churning between whether they have an unlimited plan or not.
- This tells us that our unlimited plan works best for people who are likely to consume or download a considerable quantity of data, of at least 5GB; this is because the unlimited plan is more expensive and for customers to make the most of it, they will want to consume a substantial amount of data, otherwise the price of the plan wouldn’t be worth it.
We can also investigate if there is any correlation between churn rate and extra data charges for customers who are not on an unlimited plan:
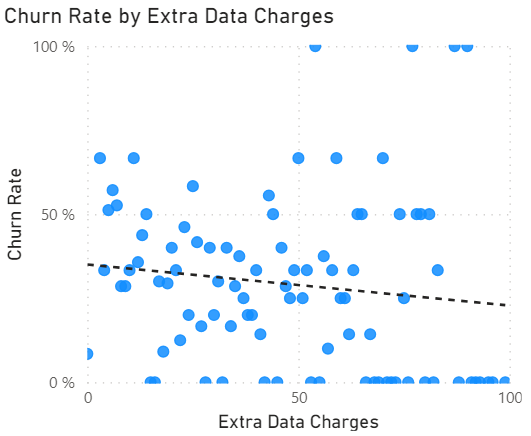
- There’s a slight negative correlation, meaning that as customers consume more extra data, the churn rate actually decreases slightly. This suggests that Databel should check their extra data prices and adjust them to slightly more expensive than the unlimited plan.
International Calls Analysis
We have a column ‘Intl Plan’ to know if customers have acquired an international plan to call internationally for free; this is premium plan that charges more per month. ‘Intl Active’ tells us whether the customers are calling internationally or not. First, let’s inspect compare their churn rates:
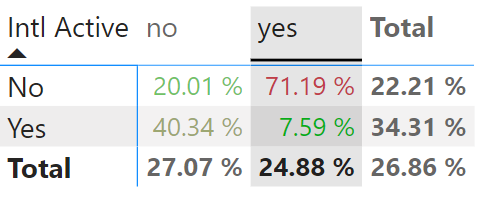
- The customers that are most likely to churn, with a whopping percetange of 71.19%, are the ones that have an international plan but don’t use it. This is expected, since the premium plan for international calls is more expensive, and it’s not worth for people who don’t use their benefits.
- Customers that have an international plan and use it are the least likely to churn. Customers that don’t have this premium plan and don’t call internationally aren’t very likely to churn either.
- However, customers that do call internationally but don’t have a premium plan are also likely to churn (40.24%). This can be explained because international calls in Databel are usually more expensive.
Now, the “Intl Active” only tells us whether they made at least one international call. So, to be more accurate, we want to analyze the number of international minutes they used in a month to see the effect of whether customers are using their international call a lot or just a little. To do this, we’ll create a column “Intl Min Category”, that categorizes the values for “Intl Mins” (Very Low < 30, Low <60, Moderate < 200, High <500 and Very High ≥ 500).
Intl Min Category = if('Databel - Data'[Intl Mins]<30, "Very low", if('Databel - Data'[Intl Mins]<60, "Low", if('Databel - Data'[Intl Mins]<200, "Moderate", if('Databel - Data'[Intl Mins]<500, "High", "Very High"))))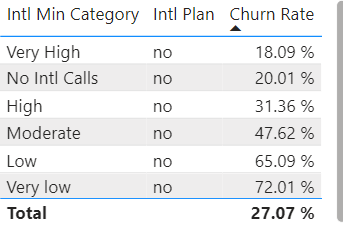
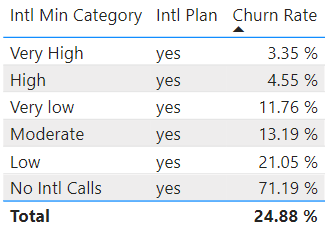
- There’s a clear pattern for customers that don’t have an international plan, the churn rate is lower as the they make more international calls. This might be a sign that Databel isn’t charging enough for international calls, which would make customers see the international or premium plan not worth it.
- For customers who have an international, we can confirm that those who makes less international calls are more likely to churn, since that arent’t making the most of their premium plan.
Contract and Payment Type
We want to delve deeper into the contract and payment types Databel’s customers have and use to understand more why they’re churning.
First, let’s make a pie chart of the payment methods to see which are more popular among Databel’s customer:
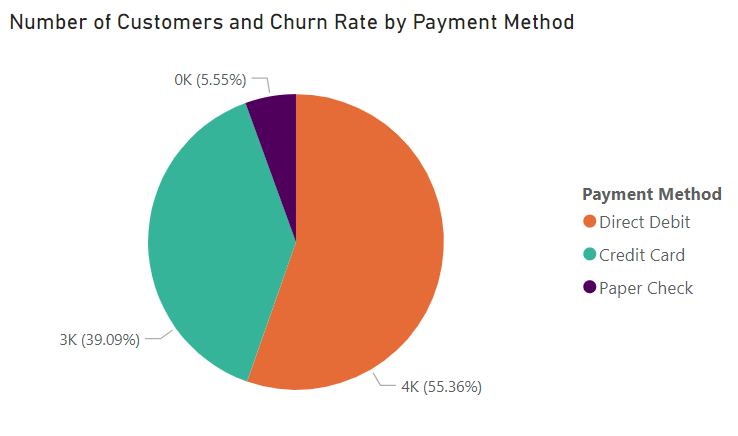

- Most customers pay by direct debit (55.36%), followed by customers who prefer to pay by credit card (39.09%). Since internet and mobile services are utility bills and are paid monthly and always, it’s more convenient for Databel’s users to pay by direct debit, since this allow for withdawals with no action from the customer.
- The paper check payment methods is the least used, and also the method in which users churn the most.
- Payment by credit card is also popular among users and these users are the least likely to churn. This might be explained by the fact that when paying by credut card in Databel, the customer is always aware of this expense; while with direct debits, customers might forget about this payment, and they can also cancel at any time.
Now, let’s analyze the time users have been Databel’s customers, to see if there are any trends in their churn rate and the account length.
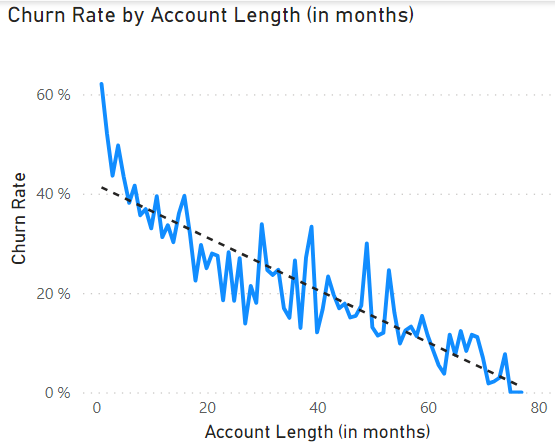
- There’s a negative correlation between the account length and the churn rate, which means that as the account length goes down, the churn rate goes up.
- This means that customers that have been a longer time with Databel (using Databel’s services) are much less likely to churn compared to more recent customers that are starting using the services.
- It’s very important for Databel to retain older customers, because they like its services and are mostly loyal and happy; but Databel also needs to address new users by giving them great offers and quality services, since these customers are very likely to churn, even after using the services for a little more than just a couple of months.
Now let’s visualize the account length by the type of contract:

- The insight (negative correlation) we found earlier, only applies to customers with month-to-month contracts. These contracts are most expensive within Databel’s plans, so newer customers are more likely to churn because of this.
- There’s a slight positive correlation between the account length and the churn rates for customers with one-year contracts. This means that older customers with one-year contracts are actually more likely to churn than newer customers with these type of contract. However, the overall churn rate for customers with one-year contracts is lower than for monthly contracts.
- There’s a very slight, almost inexistent positive correlation for customers with two-year contracts. This means that it doesn’t matter whether users with two-year contracts are older or newer to Databel, they all have similar churn rate. The overall churn rate for customers with two-year contracts is much lower than for other customers, as we saw earlier.
We can also see a similar pattern when we plot only monthly and yearly contracts, and using the average account length of customers.
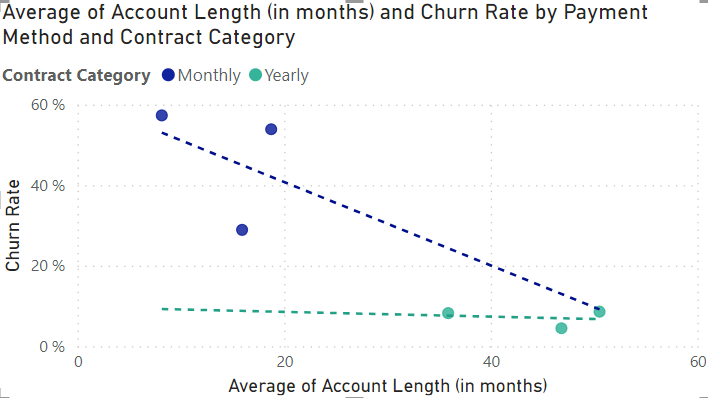
- As we saw earlier, for monthly contracts the slope is leftward or inverse, which means that customers with monthly contracts churn more as they have less time using Databel’s services.
- For customers with yearly contracts, there’s no clear relationship between account length and churn rate, meaning that it’s not important the time a client have been using Databel services for estimating the likelihood of churning for customers that have at least a one-year contract.
Customer Service Calls and Device Protection Analysis
Let’s explore quickly the number of service calls, the total and the average per customer:
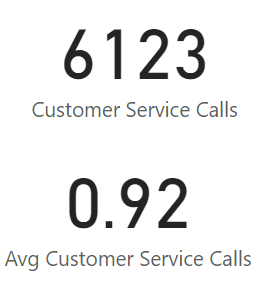
To put this numbers in context, we can create a scatter plot for the churn rate vs. the average number of service calls by customer:
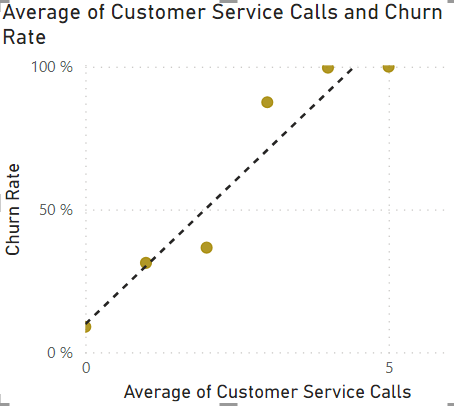
- As expected, as more service calls a customer makes, the more likely the customer is to churn.
We can also relate the average number of service calls by states, depending on whether the customer churned or not:

- In general, the more customer service calls a user makes, the more likely those customers are to churn.
- However, there’s an outlier in California, where customers churn even if they have made only one customer service call. This suggest there’s a problem with customer service in California and Databel’s representatives should probably be better trained, compensated, motivated and/or monitored.
- This is in harmony with the fact that California has the highest churn rate, which reinforces the idea that customer service representatives in California might not be trained or compensated well enough.
Databel also provides a service protection and backup for its clients’ devices. This service represents additional charges and is included in the unlimited or premium plan.

- This service causes less customers to churn, so Databel should emphasize this service in their marketing campaigns and make it easily accessible, meaning their cost should be low.
Charge Analysis
Let’s also investigate whether there’s a reltionship between churn rates and the monthly charge customers incur:
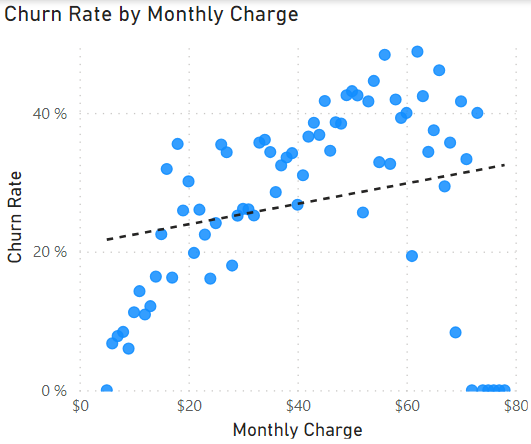
- There’s a positive correlation between monthly charge and churn rate, which means that customers who are charged more every month for Databel’s services, are more likely to churn.
Now, we want to know the main reasons or the main service that contributes to those larger charges. We can start with local minutes and international minutes:
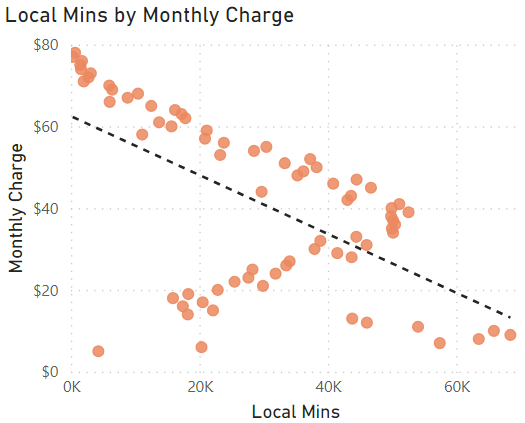
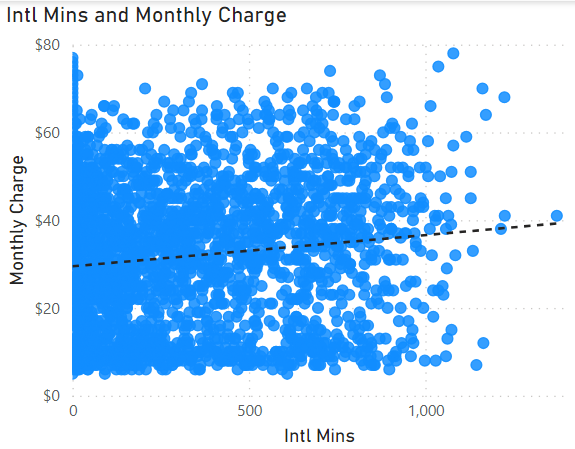
- Local minutes aren’t the reason of customers being charged more, as there’s actually a negative correlation with monthly charge.
- On the other hand, international calls do contribute slightly to the total amount that is charged per month, being an important factor.
Let’s see how much extra data charges contribute to the overall charge:
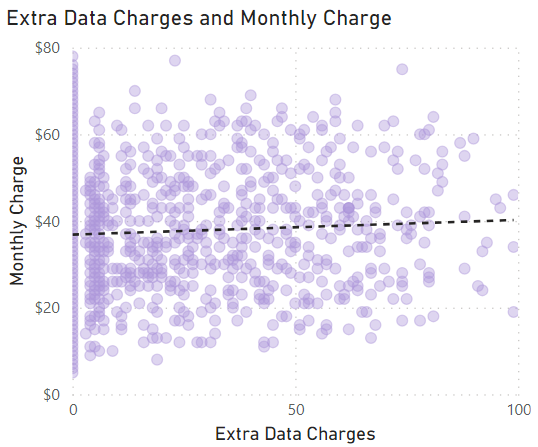
- Extra data charges contribute slightly to the overall charge.
Lastly, let’s visualize the contribution of the amount of data consumed and the unlimited plan on monthly charge:
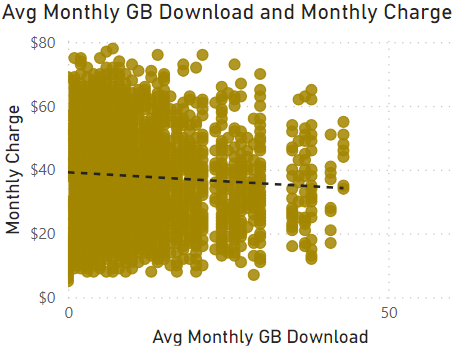
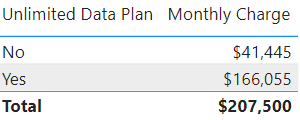
- The amount of GB consumed has a slight inverse impact on customer charges. This is likely due to the unlimited or premium plan, where users might or might not consume a lot of data even if they have an unlimited plan.
- The unlimited data plan directly impacts the monthly charge of customers.
- Databel should adjust their unlimited or premium plan price, because it seems to be too expensive for most customers, compared to the extra charges incurred, so there are many Databel’s customers who prefer to just incur extra charges without opting for the unlimited plan because of the price.
Summary of the Analysis
The data columns were formatted accordingly and organized by churn label, unlimited plan and grouped consumption.
Insights and trends that were discovered from the analysis:
- The main drivers of customer churn are better offers and devices from competitors, but dissatisfaction with customer support is also a notable factor.
- California exhibits a substantial churn rate, indicating the need for targeted strategies in that region.
- Senior customers, especially those between 70–85 years old, demonstrate a higher likelihood to churn.
- Customers on group plans spend less and show lower churn rates, aligning with the company’s discounted pricing for group services.
- Monthly payers constitute the majority and are associated with higher churn rates, while yearly contract customers are much less likely to churn.
- Customers who churn generally make fewer local calls and spend less time on calls.
- Customers with unlimited data plans are more likely to churn.
- Those downloading or consuming between 5 and 10 GB are more likely to churn compared to those using less than 5 GB or at least 10 GB.
- For customers consuming less than 5 GB, those with an unlimited plan are more likely to churn, while those without the plan are the least likely to churn.
- A slight negative correlation exists between extra data usage and churn.
- Customers with international plans who don’t use them are most likely to churn.
- Customers using international plans are least likely to churn, while those without international plans and making international calls are likely to churn.
- Customers without international plans show a lower churn rate as they make more international calls.
- Most customers pay by direct debit, followed by credit card users. Paper check payments are the least used and associated with higher churn rates.
- Customers paying by direct debit, the most convenient method, have a higher churn rate.
- There’s a negative correlation between account length and churn rate.
- In California, even a single customer service call can lead to churn, indicating potential issues with customer service in the region.
- Device protection service contributes to lower churn rates.
- There’s a positive correlation between monthly charges and churn.
- Local minutes have a negative correlation with monthly charges.
- The unlimited data plan has a positive correlation with monthly charges.
These insights help to answer the business question by providing reasons and causes for which Databel’s customers are churning, because it helps us compare usage patterns by type of customers.
This way, important insights were discovered by analyzing trends in churn rates for types of customers with different contracts and usage patterns, to find out the which kinds of customers are churning more and their reasons for churning.
Presentation and Dashboard
Databel’s Customer Retention Strategies Presentation:
https://docs.google.com/presentation/d/e/2PACX-1vQtw80A5swHbWB_X0s3m4esjCsuPqcS3oE2R_nk6yuxi9shU9DiSxUz5wv77SL0wA/pub?start=true&loop=true&delayms=3000&slide=id.p18
Jaime A. Velasquez’s Portfolio — GitHub Repository:
https://github.com/jaimeandrevelasquez/jaimeandrevelasquez.github.io
ACT PHASE
Conclusions
- Databel competitors are offering better devices and prices.
- Databel’s customer service and support aren’t satisfying users.
- Senior customers are the most likely to churn.
- Group plans and longer-term contracts customers are the least likely to churn.
- Yearly contracts show a notable low churn among customers.
- There’s an underutilization of Databel’s call services, which contribute to churn.
- Customers who consume a regular amount of data are more likely to churn.
- Extra data prices aren’t as high as they should be.
- Customers with unlimited data plans might churn if they don’t use a substantial amount of data.
- Longer-tenured customers are less likely to churn.
- More customer service calls correlate with a higher likelihood of churn.
- In California, customer service is even worse.
- Device protection services impact positively on customer satisfaction.
- Higher monthly charges lead to higher churn rates.
- International calls and extra data charges directly contribute to the overall charge.
- The number of minutes spent on calls contribute inversely to the overall charge.
- The unlimited data plan directly impacts monthly charges.
Recommendations
1. Targeted retention strategies for two segments: Databel needs to implement segmented retention strategies based on customer tenure. They should focus mainly on newer customers and constantly offer them promotions and discounts for their international and unlimited data plans, to persuade them to stay with Databel. For long-term customers it’s also important that Databel exclusive loyalty rewards and personalized promotions to ensure they keep using Databel’s services.
2. Marketing campaign for new users: Databel should target new users in their marketing campaigns, emphasizing the promotions and special plans they have, like service groups, the unlimited plan, and the international plan, which are offer the most value for users. They should also draw attention to yearly contracts, that offer special low prices and discounts.
3. Optimize contract prices: Databel should review and optimize pricing structure for different types of contracts, considering prices of competitors. They should consider a more competitive price for monthly contracts to retain new customers, while ensuring that longer-term contracts offer compelling value.
4. Adjust data plans and fees: Databel should implement more flexible data plans that align with customer data consumption patterns, so they are aligned with varying levels of data usage and with competitors’ pricing structures. They should reassess the prices of the regular plans, as well as the unlimited data plan, and the extra data charges fees.
5. Adjust fees for international calls: Databel should reassess the pricing of the regular international calls, the international plan, and the extra international charges, so that they’re more aligned with customer’s expectations and competitors’ pricing.
6. Address customer service experience: Databel should invest in process improvements and comprehensive training and incentives for customer service representatives, overall and with special emphasis in California, so customer support becomes much more efficient and satisfy Databel’s customers.
7. Education and high digital media engagement: Databel should launch campaigns on digital media to educate customers about the factors and habits influencing monthly charges. They should also clearly communicate the value of different services, plans, fees and contracts, so users are able to decide which is most convenient for them.
Further Exploration:
- Obtain time-series data and conduct data analysis for different periods of time, so Databel can understand different seasonal trends and patterns, and analyze what changes or decisions Databel takes is impacting customer retention the most either positively or negatively.
- Obtain usage data based on time of the day like data consumption and call hours, so Databel can analyze usage customer trends per day and week.
- Conduct surveys to collect feedback from customers who are in different kinds of contracts and plans to understand further their complaints and level of satisfaction and identify areas for improvement in plans and services.
- Undertake a comprehensive analysis of competitors in the telecommunications industry, that offer similar services to Databel’s. Compare Databel’s pricing, services, plans and promotions to further shape customer retention strategies, and identify areas for improvement and opportunities for differentiation.
And that’s the end of our Data Analytics Case Study! Thank you for reading, I hope you’ve found it interesting, useful and inspiring.
Comments
Post a Comment